Sankey
The Sankey Function
def sankey(edges_segmentN, node_labels=False):
Creates Sankey Graph from defined edge list and optional user-provided labels edges_segmentN: List of Tuples node_labels: Optional Dictionary of Values; keys are originals, values are replacements Returns a Sankey graph.
Remove self-to-self recursions
edge_list_temp = []
for row in edges_segmentN:
    if row[0] != row[1]:
        edge_list_temp.append(row)
edge_list = edge_list_temp
Create a counter to count how many elements are in the edge list
edge_list_counter = collections.Counter(edge_list)
Extract source list, target list, and value list from the tuples
source_list = [i[0] for i in edge_list_counter.keys()]
target_list = [i[1] for i in edge_list_counter.keys()]
value_list = [i for i in edge_list_counter.values()]
Extract the node names if node_labels does not exist as an argument
nodes = []
for row in edge_list:
    for col in row:
        if col not in nodes:
            nodes.append(col)
Replace node names with the give node_labels if it is given as an argument
if node_labels:
    new_nodes = []
    for node in nodes:
        if node in node_labels:
            new_nodes.append(node_labels[node])
        else:
            new_nodes.append(node)
Sources are the nodes sending connections
sources = []
for i in source_list:
    sources.append(nodes.index(i))
Targets are the nodes receiving connections
targets = []
for i in target_list:
    targets.append(nodes.index(i))
Values are the weight of the connections
values = value_list
If node labels is given as an argument, we replace nodes with node labels If not, we use the original node names
if node_labels:
    fig = go.Figure(data=[go.Sankey(
        node=dict(
            label=[new_nodes[item].split("|")[0] for item in range(len(new_nodes))],
        ),
        link=dict(
            source=sources,
            target=targets,
            value=values
        ))])
else:
    fig = go.Figure(data=[go.Sankey(
        node=dict(
            label=[nodes[item].split("|")[0] for item in range(len(nodes))],
        ),
        link=dict(
            source=sources,
            target=targets,
            value=values
        ))])

fig.show()
Sankey Example
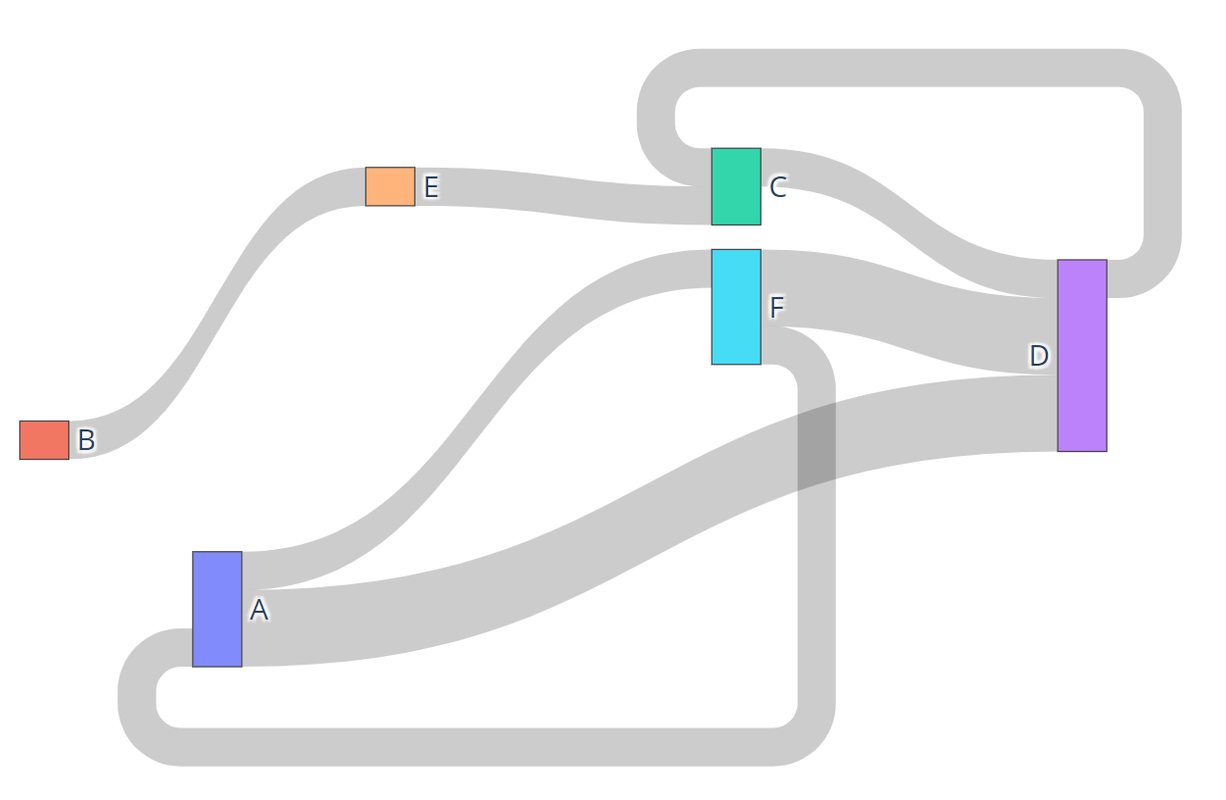
sankey(edges_segmentN, node_labels=False)
The Sankey Function passes an edge list, or a list of tuples, and returns a Sankey, or a flow chart where width corresponds to quantity. Below is an example of a Sankey Diagram:
 Additionally, users have the option to pass a dictionary
of node labels to replace existing labels.
Additionally, users have the option to pass a dictionary
of node labels to replace existing labels.
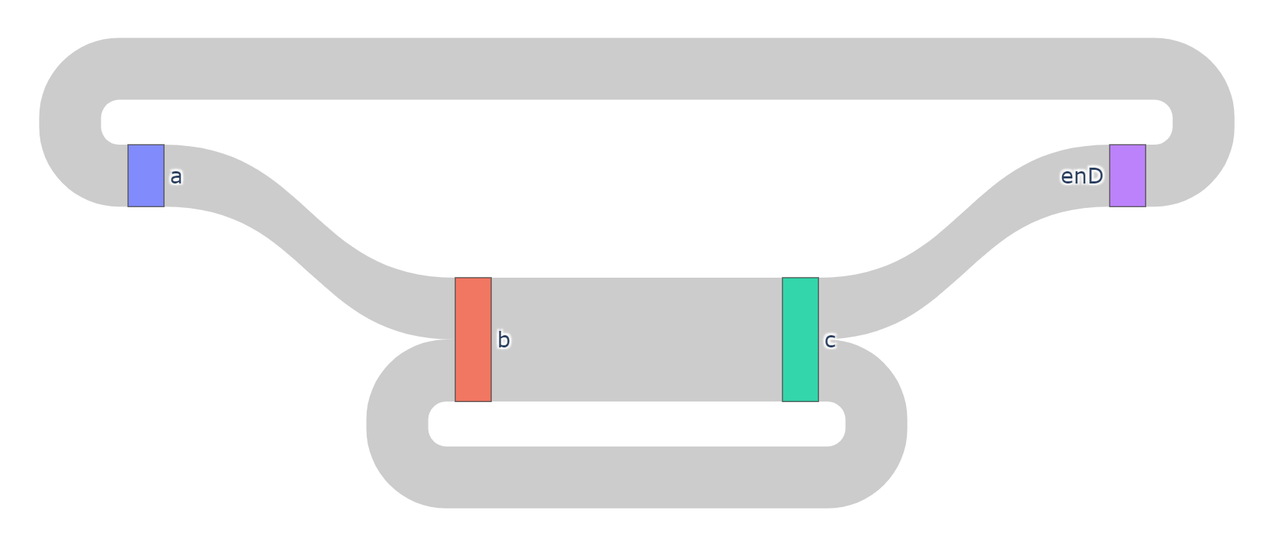
Below is an example:
Input:
edges = [('a','b'),
         ('b','c'),
         ('c','b'),
         ('b','c'),
         ('c','d'),
         ('d','a')]

labels = {'d':'enD'}

sankey(edges, labels)
Output: